Why We Publish What Didn't Work

Our study of a year at the University of New Haven keeps the small samples and the criticism in. Why, and the questions every student success program evaluation should answer: denominator, period, definition, baseline.
Key takeaways
- Most program claims leave out the denominator, the period, the definition of the outcome and what didn't move.
- Our study publishes its small samples, students' criticism, a finding about over-agreement and an honest read that Journey isn't yet a product most students would miss.
- The survey items about authorship moved the most, and the caveats are what let a reader trust that.
- Ask every vendor, and your own programs, for the denominator, period, definition, comparison, selection, sample and who measured.
Most results pages in student success, ours included, lead with a number. Far fewer tell you the denominator, the period it covers, how "engaged" was defined, or what didn't move. That's the gap an institutional researcher falls into when a board asks whether a program worked, and it's why our study of a year at the University of New Haven keeps the criticism in. This note explains what we published that doesn't flatter us, why, and the questions we think every program evaluation, ours included, should be able to answer.
What we published that doesn't flatter us
The study, From Default to Author, is public on our research page. Alongside the results, it carries four things most case studies leave out.
The sample is small
The survey that tracked change across the year was answered by the same students in the fall and again in the spring, paired by participant so every change is within one person. That's a strength and a limit. The paired group is small, and the deeper questions rest on an even smaller one: the students who answered them in depth in both waves. The study calls the survey directional, not definitive, and we mean it.
Students told us what didn't land
One student told us that when they said they felt lonely and had no friends, Journey suggested joining clubs, and it felt insensitive. Another asked for near-instant replies and for more than text messages, such as an app. Those comments sit in the study next to the praise, because they're the part that tells us what to build next.
A mirror reflects distortions too
Journey builds nudges from a student's own words. The same mechanism has a cost: a student who arrives convinced everything is going wrong gives the system a distorted story to reflect back. We measured how often Journey went along with a student's framing when it shouldn't have, and it wasn't uniform. It was worst in advice about relationships, where the student's account is the most one-sided. The study's own phrase is that this is a design that isn't finished.
Not yet a product students would miss
We asked students how they'd feel if Journey disappeared. The share who said they'd be very disappointed rose only a little across the year, and stayed well short of the benchmark product teams commonly use for a product people rely on. The research page says it plainly: real movement across the year, but not yet a product students would miss if it vanished.
One more finding cuts against us in a quieter way. Staff, asked in December, reported more change in students than students reported in themselves. We treat that gap as a finding, not a discrepancy to explain away.
What did move
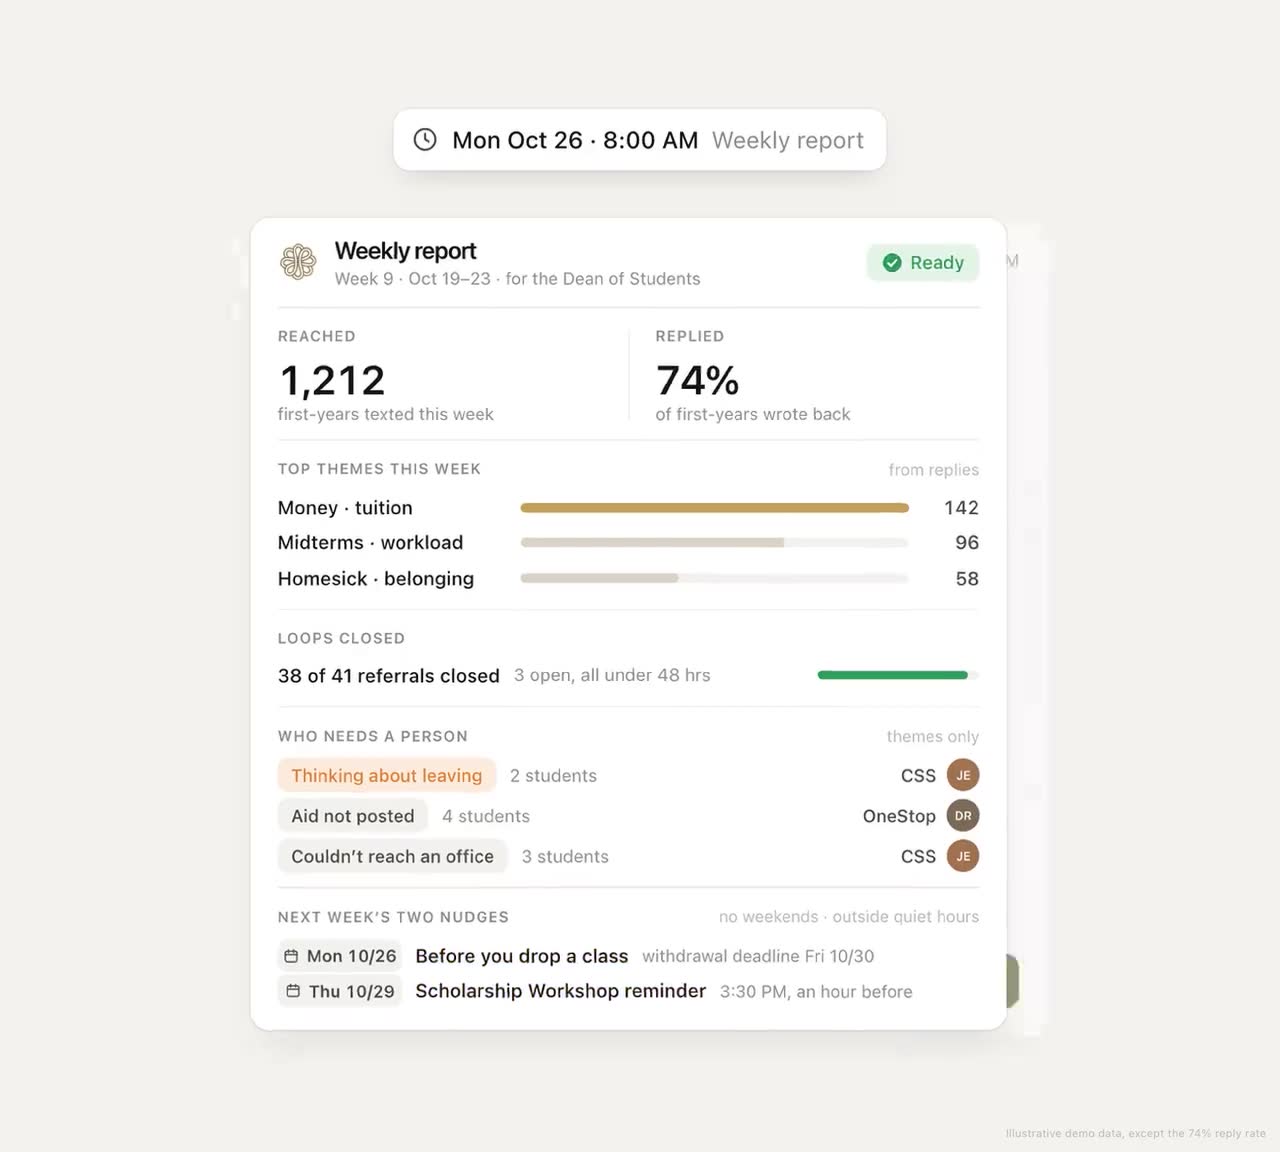
In a paired survey of 19 students, the share who said Journey made it easier to do what they already wanted to do rose from 14% in the fall to 71% in the spring. Of all the survey items, the ones about authorship, whether a student feels like the author of their own choices, moved the most. In a typical week of the University of New Haven pilot, 74% of students replied to Journey or acted on a nudge. That's a weekly figure, not a count of everyone who replied at least once all term, and the difference matters.
We put the caveats next to those findings on purpose. A reader who has seen the small sample and the criticism can judge the good numbers for what they are.
Why publish the hard parts
Three reasons, in order of how much they matter to us.
It's what a careful reader needs. A dean deciding whether to expand a program, or an IR office asked to check a vendor's claims, needs the same things a journal reviewer would: who was measured, over what period, against what. A clean story without them invites the wrong decision, in either direction.
Criticism is a roadmap. The loneliness comment and the over-agreement finding are worth more to our product than any of the praise. Hiding them would mean hiding the to-do list.
Trust compounds. A campus that catches a vendor rounding up once discounts everything that vendor says afterward. We'd rather be believed about smaller numbers.
Questions to ask every vendor, including us
If you're evaluating a student success program, this is the list we'd want in your hands. Ask for the answers in writing.
| Ask | Why it matters |
|---|---|
| What's the denominator? | A rate among students who opted in can look very different from a rate across the cohort |
| What period does it cover? | "Engaged this term" and "engaged in a typical week" are different numbers |
| How is the outcome defined? | An open, a reply and a booked appointment are not the same thing |
| Compared with what? | The same students before, a matched group, or last year's cohort each tell a different story |
| Who chose the participants? | A pilot with volunteers says less than one with a whole cohort |
| How many answered, and was it paired? | Pooled surveys can move simply because different students answered |
| Who measured it? | Vendor analysis, campus IR and outside evaluators carry different weight |
| What didn't move? | Every honest evaluation has an answer. "Nothing" is not one |
| Can we see the instrument? | Survey wording shapes the answers |
Use the same list on your own programs. The first time a campus team writes down the denominator and period for its own headline retention figure, it may find two versions of the number circulating, and a third in last year's board deck.
We'd rather lose a deal to a skeptical reader than win one with a number that falls apart in the first meeting with your IR office. The study is on the research page, caveats and all.
Frequently asked questions
How do you evaluate a student success program?
Define the outcome before you start, name the denominator and the period, pick a fair comparison such as the same students before or a matched cohort, and record who measured it. Report what didn't move alongside what did.
What questions should we ask a vendor about their results?
Ask for the denominator, the period, how the outcome was defined, what it was compared with, who chose the participants, how many answered and whether answers were paired, who measured it, and what didn't move.
Why does the denominator matter in engagement figures?
A rate among students who opted in can look very different from a rate across a whole cohort, and a weekly rate is different from anyone who replied once all term. Without the denominator and period, two numbers that look comparable often aren't.