Reporting Student Retention to Your Board

What a board of trustees wants from a retention report: the number, the trend, what you did, what it cost and what's next. Definitions and denominators, student voice, a yearly calendar, a monthly one-pager and a term deck.
Key takeaways
- Answer five things in order: the number, the trend, what you did, what it cost and what's next.
- Print the definition and the count of students with every rate, and keep both the same all year.
- Map when each number becomes known (census dates, IPEDS reporting) to the board's meeting calendar at the start of the year.
- Bring student voice as themes with counts, and quote a student only with permission.
A retention report to a board gets a few minutes of attention and leaves one number in people's heads. The provost wants the good news first, institutional research wants the footnotes, and you have one page.
A retention report for a board of trustees works when it answers five questions in order: what's the number, which way is it going, what did we do, what did it cost, and what's next. Most of the work is settling the definitions early and keeping them the same all year.
What a board of trustees wants from a retention report
| Question | What answers it |
|---|---|
| What's the number? | One retention or persistence rate, defined, with its count of students |
| Which way is it going? | Five years of trend, peers for context, and the gaps between groups of students |
| What did we do? | The two or three initiatives that mattered, who they served, and what changed |
| What did it cost? | The full cost, including staff time, and how you'd judge whether it paid off |
| What's next? | One recommendation, and the decision you need from the board, if any |
Boards govern; they don't manage. They want to know whether the institution is on track and whether the plan is sound. Weekly operational detail belongs with the president's cabinet.
Get the definitions right before the number
Nothing derails a board conversation faster than a trustee noticing that this year's number was counted differently from last year's. Settle the definitions with institutional research once and print them on every report.
| Measure | What it counts | When you know it |
|---|---|---|
| First-year retention (the federal IPEDS measure) | First-time, degree-seeking students from the fall cohort who are enrolled again the next fall, with full-time and part-time students reported separately. At four-year institutions the cohort is bachelor's-seeking students; at other institutions, students who completed also count | The next fall's official reporting date |
| Fall-to-spring persistence | Students from the fall cohort enrolled at the spring census | Spring census, months earlier |
| Program cohort persistence | The same measure, for students in a specific program only | Spring or fall census |
| Weekly engagement | A leading indicator, such as the share of students who replied or acted that week | Every week |
- Say "retention" or "persistence" deliberately. Many in the field use retention for students who return to your institution and persistence for students who stay enrolled anywhere. The National Student Clearinghouse Research Center uses them that way. Pick one usage and footnote it.
- Give the count with every rate. "78% of 1,240 first-time, full-time students who started in fall 2025" (illustrative) is a claim. "78%" is a mood.
- Label program numbers as program numbers. A 100-student program's persistence rate is not the institution's retention rate, and putting them side by side without labels invites the wrong conclusion.
- Note the exclusions. IPEDS allows a short list, such as students who left for military service. Use the same exclusions every year.
Show the trend and the gaps
A single year means little to a board. Five years of the same measure, on one small chart, shows whether this year is a change or noise. Add context from your peer group: NCES produces an IPEDS Data Feedback Report for each institution every year, comparing it with a peer group the institution can choose.
Then show the gaps. Break the rate out by Pell status, first-generation status, race and ethnicity, full-time and part-time, and residential and commuter students. The gaps usually tell you where the next initiative belongs. Suppress any group too small to report safely; institutional research will have a minimum cell size.
A reporting calendar for the year
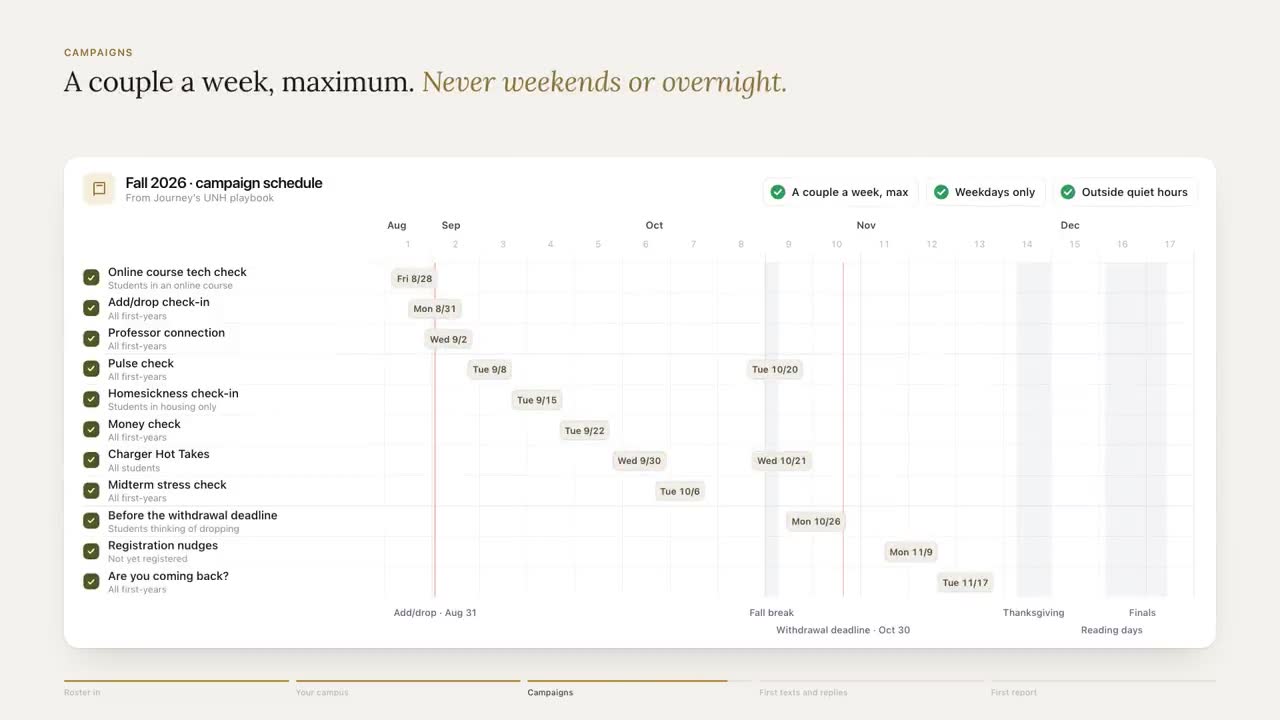
Retention numbers arrive on their own schedule, and board meetings rarely line up with it. Map one to the other at the start of the year so nobody is surprised by what can and can't be reported.
| When | What's known | What to report |
|---|---|---|
| Early fall, after census | Last year's first-year retention, final | The headline number, the trend and the gaps |
| Mid-fall | Leading indicators for this year's first-years | Engagement, referrals kept, early alerts closed |
| Winter, after spring census | Fall-to-spring persistence | The first real read on this year's cohort, and on any program |
| Spring | Registration for fall, holds cleared | Who has registered, and who hasn't, as a forecast |
| Summer | The year's program results and costs | What to continue, expand or stop, before the budget closes |
Your board's calendar will differ. The point is to agree in advance which number goes to which meeting, so a slow quarter isn't filled with a number that hasn't settled yet.
Report what you did, and what it cost
For each initiative, give one row:
| Initiative | Who it served | What changed so far | Full cost | Result known by |
|---|---|---|---|---|
| Text outreach to first-generation first-years (example) | The 100 students in the program | Weekly reply rate, referrals kept, holds cleared before registration | Program fees plus staff hours | Spring census |
| Hold-clearing campaign before registration (example) | Students with holds in week 8 | Holds cleared before registration opened, against last year | Staff hours | Registration week |
Be honest about attribution. Several things changed at once, and one year of one program is evidence, not proof. Say what you'd need to see next year to be confident. If the board wants a return figure, use a method the budget office has signed off on; our guide to calculating the return on a retention program lays one out.
Student voice without breaking privacy
Trustees remember students more than percentages. You can bring students into the room without exposing anyone.
- Themes with counts. "Money came up in about a third of first-year replies in October, mostly about billing dates" (illustrative). That's specific, and no one is identifiable.
- Quotes only with permission. If you quote a student, ask first, remove anything identifying and say the quote is used with permission.
- No names, no transcripts, no small groups. Board materials are often shared beyond the room. Treat them that way.
The monthly one-pager and the term deck
The monthly page
If your president or provost wants a monthly update between board meetings, keep it to one page with the same layout every month, so changes jump out.
- The number this month. The leading indicator (weekly engagement, referrals kept), plus persistence when a census has happened.
- The trend. One small chart since the start of term.
- What students raised. The top themes, with counts.
- Students flagged for a person, and how fast they were reached.
- What we did and what changed. Two or three lines.
- One decision or request. Or "none this month".
The end-of-term deck
Eight slides is usually enough for a board committee:
- The number, with its definition and count of students.
- Five years of trend, with peer context.
- Gaps by student group.
- What we did this term.
- What moved: leading indicators and any census results.
- What it cost, and how we'll judge the return.
- What students told us, as themes.
- What's next, and the decision we need.
Put the definitions in a footnote on the first slide and keep them there all year.
A sentence a trustee can repeat
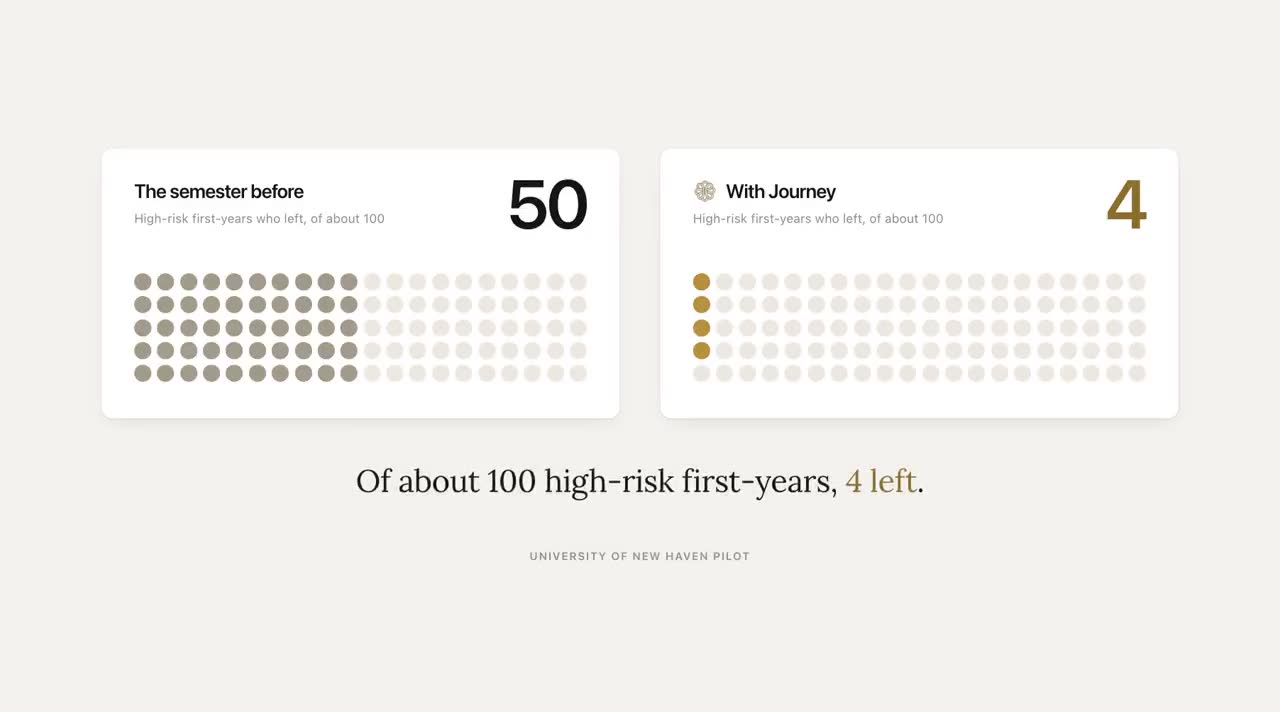
The best board reports give trustees one sentence they can repeat accurately in the hallway afterward. When we report our own pilot, we lead with this one: Of about 100 high-risk first-years in the University of New Haven pilot, 4 left. The semester before Journey, 50 high-risk first-years did.
It works because it carries its own denominator, names the group and states the comparison. Whatever your number is, write the sentence the same way: the group, the count, the comparison, with a footnote on how the comparison group was chosen.
Questions trustees ask, and mistakes they notice
Prepare for these before the meeting, and bring what answers them.
- "How do we compare with our peers?" Bring the peer comparison from the IPEDS Data Feedback Report, and know which peers are in it.
- "Which students are we losing?" Bring the gaps by group, with counts, and the reasons students give when they leave if your campus collects them.
- "What would it take to move the number two points?" Bring the arithmetic: two points is how many students, and which program could plausibly reach them.
- "Is the program working?" Bring the leading indicators now and the date the census result will be known. Don't promise a result before it exists.
Mistakes boards notice
- A definition that changed between meetings. If it had to change, say so on the slide.
- Percentages without counts. A 10-point gain in a group of 20 students is two students.
- Program results shown as institutional results.
- Causation claimed from one year.
- Bad news in the appendix. If a number fell, put it on the main page with what you're doing about it. Trustees tend to find it anyway.
What Journey's dashboard gives the monthly page
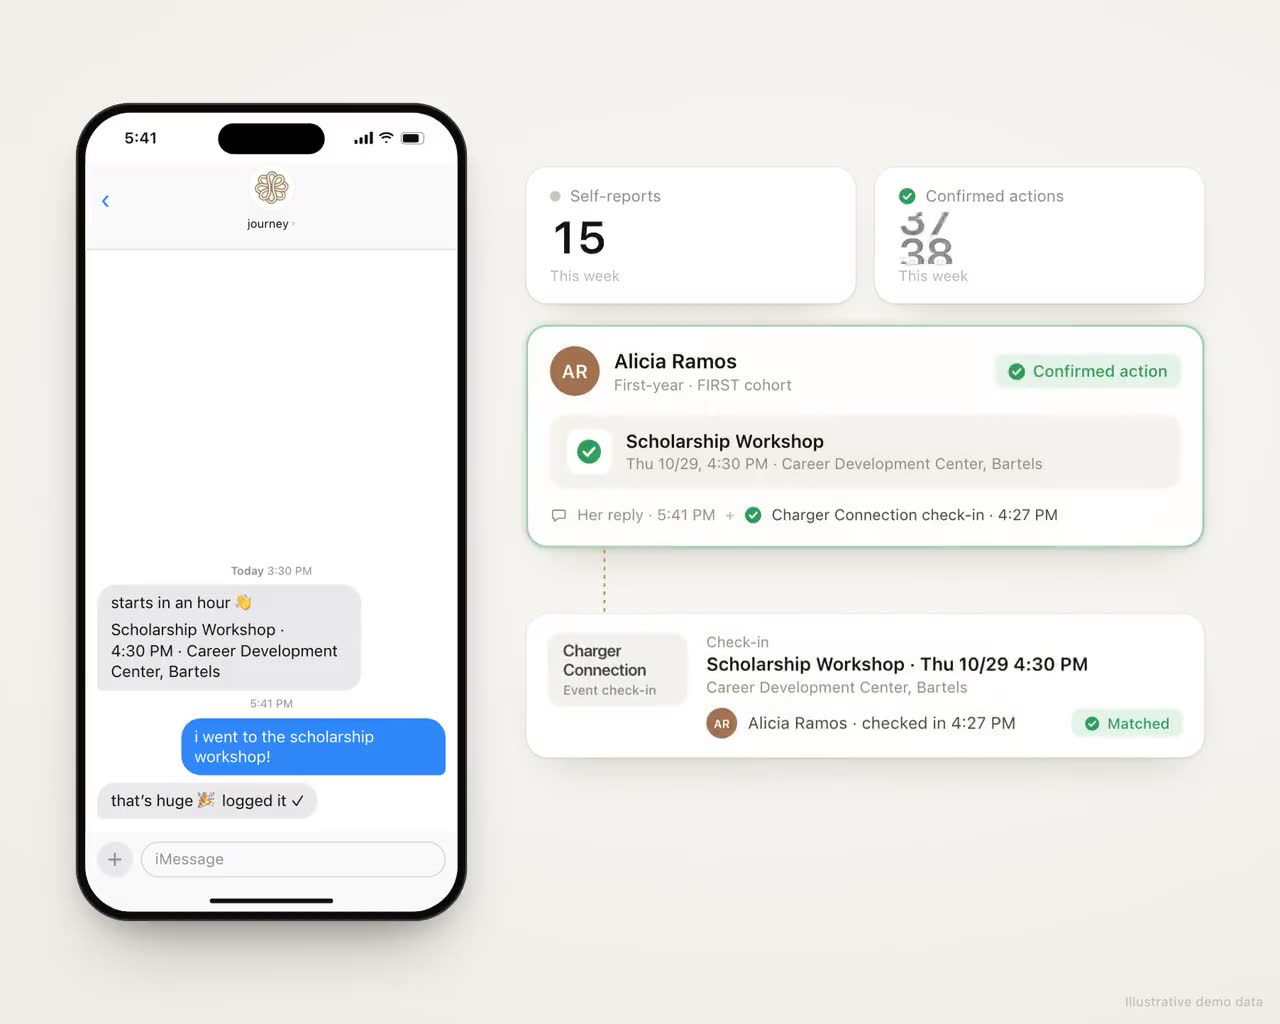
The partner dashboard holds most of the inputs for the monthly page: the students flagged for a person each week, the themes in what students wrote, and the strip of headline figures at the top. Today someone on your team turns those into the page. A dean's report that writes itself and arrives by email at 8 AM every Monday isn't live yet. For which engagement numbers belong in front of leadership, see Student Engagement Metrics That Mean Something.
Draft next quarter's page now with last quarter's numbers, send it to institutional research, and ask them to sign off on the definitions in the footnote.
Frequently asked questions
What should a retention report to the board of trustees include?
One defined retention or persistence rate with its count of students, five years of trend with peer context, gaps by student group, the initiatives you ran and what they cost, and a recommendation or decision you need.
How is first-year retention defined for IPEDS?
In general terms, it's the share of first-time, degree-seeking students from a fall cohort who are enrolled again the next fall, with full-time and part-time students reported separately. At four-year institutions the cohort is bachelor's-seeking students; at other institutions, students who completed also count. Institutional research can confirm the exact rules and exclusions your campus uses.
What's the difference between retention and persistence?
Many in the field, including the National Student Clearinghouse Research Center, use retention for students who return to the same institution and persistence for students who stay enrolled at any institution. Choose one usage for board reports and footnote it.
How often should student success leaders report retention to the board?
Most boards see retention at a few meetings a year, timed to when census numbers are final. Between meetings, a one-page monthly update to the president or provost keeps leading indicators visible.
How can we share student feedback with a board without violating privacy?
Report themes with counts, such as how often money came up in replies in a given month. Quote a student only with permission and with identifying details removed, and avoid names, transcripts and very small groups.